A student growth goal measures the change in a student’s skill or knowledge between two points in time, not just their final score. Write yours around a single instructional unit: pick a baseline, choose two to three measures (a formative check, a piece of student work, and teacher observation), and set a SMART target tied to that evidence. Start there, and the rest of your goal, from monitoring to tiered targets, follows naturally.
TL;DR:
- Growth targets should be based on multiple measures, including formative checks, student work, and teacher observations, not just end-of-unit assessments.
- Tiered targets customized to students’ starting points promote fairness and equity, with flexible regrouping between units based on pre-assessment data.
- Frequent progress monitoring and trend-line analysis are essential for timely instructional adjustments and avoiding reliance on a single snapshot.
- Growth goals for English learners and students with disabilities must reflect their actual starting points and progress in content and language development.
- Implementing unit-based growth cycles with specific checkpoints encourages iterative teaching improvements more effectively than year-long goals alone.
Table of Contents
- What Is Student Growth, and Why Prioritize It Over a Single Score?
- The SMART Framework for Student Growth Goals, With Ready-to-Use Examples
- How to Write a Unit-Based Growth Goal, Step by Step
- What to Measure, How Often, and How to Read the Data
- Setting Targets That Are Rigorous, Fair, and Actually Attainable
- Common Pitfalls in Growth Goals and How to Fix Them Fast
- Meet the Author and the Courses Built Around This Work
- Building Social-Emotional Objectives Into Growth Goals
- Why Student Self-Assessment Belongs in the Goal-Setting Process
- Personalizing Growth Goals to Individual Students and Learning Styles
- Using Technology to Track and Manage Growth Goals
- Adjusting Growth Goals for English Learners and Students With Disabilities
- Unit Cycles or Year-Long Goals: My Take on Which One to Use
- How Empowered Professional Learning Helps You Put This Into Practice
- Key Resources for Building Growth Goal Templates and Rubrics
- Sources
- FAQ
What Is Student Growth, and Why Prioritize It Over a Single Score?
Student growth is the distance a learner travels between two measurement points, not where they land on a single test day. A student who moves from a 40% to a 70% on a unit assessment has grown 30 points, regardless of whether 70% clears the school’s proficiency bar. That distinction changes how you plan, teach, and evaluate your own impact.
Achievement snapshots tell you where a student stands right now. Growth goals tell you whether your instruction is working. According to guidance from the Office of Superintendent of Public Instruction (OSPI), student growth is defined as the change in student achievement between two points in time, and effective goals draw on multiple measures rather than a single test score. This framing matters most for students who start below grade level. A proficiency-only lens can make a teacher’s excellent instruction with a struggling class look like failure, while masking stagnation in a class that started ahead.
Growth-focused goals also support equity in a way achievement targets rarely do. Two classrooms can post identical growth, even when their starting points and final scores look nothing alike, and that comparison is far more honest than ranking classrooms by raw proficiency rates. When you center growth, you’re comparing each student and class against their own baseline, not against a fixed bar that ignores where they started.
This shift shows up in several concrete ways once you start planning around it:
- You stop penalizing yourself (or your data) for teaching a class that started three grade levels behind.
- You catch stalled progress earlier, because a flat trend line shows up mid-unit, not just at report card time.
- You build a defensible record of instructional impact that survives scrutiny from administrators, parents, or state reporting.
- You create space to celebrate meaningful progress that a proficiency cutoff would otherwise erase.
State and agency guidance increasingly reflects this. Frameworks that once leaned almost entirely on end-of-year proficiency now recommend unit-based growth measurement paired with achievement data, because a single annual snapshot arrives too late to change anything. If you’re only checking growth once a year, you’re not managing instruction. You’re documenting a result you can no longer influence.
The SMART Framework for Student Growth Goals, With Ready-to-Use Examples
Every strong growth goal answers five questions before you write a single number down. The SMART framework breaks those questions into Specific, Measurable, Attainable, Relevant, and Time-bound, and each element solves a different failure mode you’ve probably seen in a vague PD-mandated goal.
Specific means naming the exact skill or standard, not a general subject area. “Improve in math” is not a goal. “Increase accuracy in multi-digit multiplication using the standard algorithm” is.
Measurable means you can point to a number or a rubric score before and after instruction. If you can’t quantify it with a formative assessment, a scored piece of student work, or a structured observation checklist, it isn’t measurable yet.
Attainable means the target reflects what’s realistic given the student’s starting point and the length of the unit, not an aspirational round number. A student reading two grade levels below benchmark won’t close that gap in three weeks, and setting a target that assumes otherwise sets both of you up to fail.
Relevant means the goal connects to a standard you’re already required to teach, not an extra initiative bolted onto your unit plan.

Time-bound means a clear start and end date, ideally matched to an instructional unit rather than a full semester or year, so you get feedback while you can still act on it.
Here are five classroom-ready examples across grade bands and content areas:
- ELA, grade 4: By the end of the six-week narrative writing unit, students will increase their score on the district writing rubric by at least one point (on a 4-point scale), as measured by pre- and post-unit writing samples.
- Math, grade 7: By the end of the ratios and proportions unit, 80% of students will score at least 75% on the unit assessment, up from an average of 52% on the pre-assessment.
- SEL, grade 2: By the end of the nine-week marking period, students will demonstrate improved self-regulation, moving from an average score of 2.1 to 3.0 on a 4-point teacher observation checklist during transition times.
- Attendance/engagement, middle school advisory: Students identified as chronically absent will increase attendance rate from a baseline average of 78% to at least 88% over one grading period, tracked weekly.
- High school biology: By the end of the genetics unit, students will improve their score on a lab-based performance task rubric from an average of 2.4 to 3.2 (on a 4-point scale).
Notice that none of these stand alone. Guidance from Pennsylvania’s PVAAS growth goals framework recommends exactly this pairing, using growth reports to identify which students or groups need the most attention while still tracking whether the class reaches grade-level expectations. Growth without an achievement anchor can drift into “anything counts as progress.” Achievement without a growth lens can punish teachers for accepting the students who need them most.
How to Write a Unit-Based Growth Goal, Step by Step
Most teachers write growth goals once a year, under deadline pressure, disconnected from the unit they’re actually about to teach. That’s backwards. Build the goal into your unit planning meeting instead, and it becomes a working tool rather than a compliance document.
- Pull baseline data before you plan instruction. Use a diagnostic, a pre-assessment, or last unit’s exit ticket data. You need a real starting point, not a guess, and you need it for every student, not just the ones you’re worried about.
- Sort students into preparedness tiers. Three tiers usually work: well below the unit’s entry expectations, approaching them, and ready to extend. This isn’t tracking. It’s a temporary grouping based on this unit’s data, and it changes unit to unit.
- Choose two to four aligned measures, incorporating print materials which play a crucial role in supporting learning as detailed in the role of print in education. A single end-of-unit test tells you almost nothing about the middle of the process. Combine a short formative check (exit tickets or a quick quiz), one piece of scored student work, and a teacher observation checklist for skills that don’t show up on paper.
- Set tiered targets, not one number for the whole class. A student entering at 30% and a student entering at 75% need different, equally rigorous targets. Write both into the goal.
- Map the unit timeline against checkpoints. Identify two or three points during the unit, not just the end, where you’ll check progress against the trend you expect to see.
- Document the instructional moves tied to each checkpoint. If the mid-unit check shows a tier stalling, decide now what you’ll change: reteach a specific skill, regroup, or add a scaffold. Deciding in advance beats scrambling later.
- Assign monitoring roles if you’re working as a grade team. Someone owns collecting the formative data, someone owns the work samples, and everyone agrees on the review date. Goals that belong to “the team” in the abstract tend to belong to no one in practice.
Pro Tip: Draft your growth goal and your first formative checkpoint on the same day you plan the unit, not after you’ve already started teaching it. If you can’t picture the exact assessment that will produce your midpoint data, the unit plan isn’t finished yet.
This process borrows directly from a short instructional-improvement cycle: plan, implement, measure, reflect, then adjust before the next unit begins. Research from the REL/IES instructional improvement toolkit recommends exactly this kind of short cycle, using simple pre- and post-assessment comparisons to test whether an instructional strategy is working before committing a full semester to it. You don’t need a district data team to run this. A shared spreadsheet and an agreed checkpoint date will get you most of the way there.
What to Measure, How Often, and How to Read the Data
A single test score is a snapshot, and snapshots hide trends. Use multiple measures, each doing a different job:
- Formative checks (exit tickets, quick quizzes) tell you what’s happening this week, before it’s too late to adjust.
- Teacher observation captures skills that don’t show up neatly on paper, like collaboration, self-regulation, or oral reasoning.
- Scored student work (writing samples, lab reports, problem sets) shows depth of understanding a multiple-choice check can’t.
- Short unit quizzes give you a periodic, standardized comparison point across the whole class.
Cadence matters as much as which measures you pick. Guidance from the Oregon Department of Education’s progress monitoring framework recommends checking progress one to two times per month for most students, and weekly for students who need intervention support. Waiting until the end of the unit to look at your data defeats the purpose of setting a growth goal in the first place.
Once you have three or more data points, two simple analyses do most of the heavy lifting. Trend-line analysis means plotting scores over time and asking whether the line is climbing, flat, or falling, rather than reacting to a single bad data point. The Four-Point Rule, drawn from the same Oregon guidance, says that if the four most recent data points fall below your goal line, it’s time to change instruction rather than wait for one more check to confirm what you’re already seeing.
Here’s how those measures line up in practice for a typical six-week unit:
| Measure | Frequency | What it tells you | Who collects it |
|---|---|---|---|
| Formative check (exit ticket/quiz) | Weekly | Whether recent instruction is landing | Classroom teacher |
| Scored student work sample | 2 to 3 per unit | Depth and transfer of understanding | Classroom teacher or grade team |
| Teacher observation checklist | Weekly or per checkpoint | Skills not captured by written work | Classroom teacher |
| Unit assessment | Start and end of unit | Overall growth against the goal | Classroom teacher or grade team |
Watch for validity problems before you trust any of this data. A reading fluency probe won’t tell you much about a student’s comprehension of persuasive writing, and a single multiple-choice test can undersell a student who reasons well but tests poorly. Pick measures that actually align with the skill named in your goal, and be honest about which of your tools measure the thing you actually taught versus something adjacent to it.
Setting Targets That Are Rigorous, Fair, and Actually Attainable
The hardest part of writing a growth goal isn’t the SMART format. It’s picking a number that stretches every student without setting up half the class to fail on day one.
Tiered targets, grounded in pre-assessment data, solve most of this. A tiered goal-setting approach groups students by preparedness level using baseline scores, then sets a different, equally ambitious target for each tier rather than one number for the whole class.
Two approaches work well, and each fits different situations:
- Same percentage growth, different starting points. Every student is expected to close roughly the same share of their gap to a target score, so a student starting further behind still has a meaningful, achievable target rather than an identical raw score everyone chases.
- Different raw-score targets by tier. Students entering below grade level target a defined point gain (say, 15 points on a 100-point scale), students in the middle target a moderate gain, and students already near the ceiling target maintenance plus enrichment, since a ceiling effect makes further raw growth mathematically harder to show.
Equity considerations should shape how you talk about and use these tiers, not just how you calculate them:
- Use asset-based language when describing tiers (“building toward grade-level fluency,” not “low group”).
- Treat tiers as unit-specific and temporary, based on that unit’s pre-assessment, not a permanent label that follows a student all year.
- Regroup flexibly between units. A student who lands in the highest tier for a fractions unit might need more support during a geometry unit.
- Avoid publishing tier labels anywhere students or families can see them as a ranking rather than a planning tool.
Tiering isn’t tracking when you do it right. Tracking sorts students permanently by perceived ability. Tiering sorts them temporarily by this unit’s data, with an explicit expectation that the groups shift.
Common Pitfalls in Growth Goals and How to Fix Them Fast
Most weak growth goals fail for one of four predictable reasons, and each has a quick fix.
Vague targets (“students will improve in reading”) give you nothing to measure and nowhere to intervene. Fix it by naming the specific skill and the exact assessment you’ll use to track it.
Overreliance on a single measure hides the real picture, especially when that measure is a standardized test taken once at the end of a unit. Fix it by adding at least one formative check and one work sample or observation measure alongside it.
Infrequent checkpoints mean you find out your instruction isn’t working only after the unit is already over. Fix it by scheduling at least two mid-unit checkpoints before you start teaching, not after a bad first assessment forces the issue.
Goals disconnected from actual instruction happen when a growth goal gets written to satisfy a compliance form, separate from what you’re really teaching that week. Fix it by writing the goal during unit planning, not after.
- Re-baseline whenever you discover your original pre-assessment data was flawed or incomplete.
- Add a second or third measure the moment you notice one data source telling a misleading story.
- Increase monitoring frequency for any tier showing a flat or declining trend line.
- Bring in an instructional coach, data analyst, or special education team member when a student’s pattern doesn’t respond to your usual adjustments.
Pro Tip: If three consecutive data points contradict your instinct about a student’s progress, trust the data over the instinct. Teachers routinely overestimate progress for students they like working with and underestimate it for students who are quieter in class.
Meet the Author and the Courses Built Around This Work
This guide draws on established state and agency frameworks for student growth measurement, including OSPI’s growth guidance, Pennsylvania’s PVAAS pairing model, and Oregon’s progress monitoring protocols, synthesized into a workflow any classroom teacher or grade-level team can run without a data science background.
Empowered Professional Learning designs its courses around exactly the gaps this guide surfaces. Educators consistently report that the practical, immediately applicable format is what separates these courses from generic PD, and each course maps to a specific piece of the growth goal process.
If choosing the right measures and reading trend-line data feels like the weakest link in your current practice, Data Literacy for Teachers walks through exactly that skill set, using classroom-ready examples rather than abstract statistics theory. If your growth goals need to reach students with IEPs, 504 plans, or a wide range of learning profiles without watering down the target, Universal Design for Learning (UDL) & Accessibility covers how to design assessments and instructional moves that work across that range from the start. And if your monitoring data shows the real issue is engagement rather than comprehension, that students understand the material but disengage before showing it, Engagement Boosters That Work offers concrete instructional moves to address that gap directly.
Building Social-Emotional Objectives Into Growth Goals
Academic growth goals shouldn’t stand apart from how a student is doing emotionally and socially, especially since executive function, self-regulation, and motivation directly affect whether a student can demonstrate academic growth at all. A student who can’t manage frustration during a math task will show flat trend lines that look like a content problem but are actually a self-regulation problem.
Build SEL objectives into your growth goal structure the same way you’d build in a reading or math target: specific skill, observable measure, defined timeline. Self-regulation, collaboration, and persistence during difficult tasks all translate into observation checklists scored on a simple scale, checked at the same cadence as your academic measures.
A useful pairing looks like this: alongside a math growth goal tracking accuracy on multi-step problems, run a parallel SEL goal tracking a student’s ability to persist through a difficult problem for at least five minutes before requesting help, scored weekly through teacher observation. When the academic trend line stalls, checking the SEL data first often reveals whether the block is content or regulation, which changes what you do next. Teachers who separate these two data streams typically catch the real problem faster than those who only track the academic number and guess at the cause.
Why Student Self-Assessment Belongs in the Goal-Setting Process
Growth goals written entirely by the teacher, for the student, miss one of the most reliable levers for improvement: the student’s own read on their progress. Students who track their own scores against a visible target tend to engage more with the specific skill being measured, because the goal stops being an abstract number on a teacher’s spreadsheet and becomes something they can watch move.
Build in a short self-assessment routine at each checkpoint, not just at the end of the unit. A simple three-question reflection works: What did I do well on this checkpoint? What’s still hard? What’s one thing I’ll try before the next check? Pair that reflection with the same rubric or checklist you’re using for your own observation data, so the student’s self-rating and your rating can be compared directly.
Discrepancies between a student’s self-assessment and the teacher’s data are often more useful than agreement. A student who rates their own writing higher than the rubric supports may need a clearer picture of the rubric’s language before the next checkpoint. A student who consistently underrates strong work may need a confidence-building conversation more than a skills-based one. Either way, the self-assessment surfaces something the raw score alone wouldn’t show.
Personalizing Growth Goals to Individual Students and Learning Styles
A single growth target applied uniformly across a class ignores the reality that students arrive with different starting points, different processing speeds, and different ways of demonstrating what they know. Personalizing the goal doesn’t mean writing thirty separate goals. It means adjusting the target, the measure, or the timeline within your tiered structure to fit what you already know about a given student.
A student who processes information more slowly but deeply might need a longer timeline to the same target rather than a lower target. A student who struggles with written expression but reasons well verbally might need an oral assessment option alongside the written measure, so the growth goal captures actual understanding rather than a writing-speed limitation. A highly visual learner working through a science unit might show growth more clearly through a diagram-based task than a text-based quiz.
Use what you already collect through routine observation and prior work samples to make these adjustments, rather than creating an entirely separate diagnostic process. The tiering approach covered earlier gives you the structural starting point. Personalization is the fine-tuning you layer on top for individual students whose needs don’t fit neatly into a tier.
Using Technology to Track and Manage Growth Goals
Spreadsheets work for tracking one class’s growth data. They get unwieldy fast once you’re managing multiple measures across several tiers for 100 or more students across sections. A dedicated tracking platform, whether a district-provided data system or a simpler classroom tool, solves the volume problem and makes trend-line analysis far faster to run.
Look for a few specific capabilities rather than the flashiest dashboard. You want a tool that lets you enter multiple measures per student (not just one test score), plots data over time so trend lines are visible at a glance, and flags students whose recent data points fall below their goal line, echoing the Four-Point Rule discussed earlier. Many district-level systems already include growth reporting features built for exactly this purpose, and it’s worth checking what your school already has access to before adopting a separate tool.
Whatever platform you use, the technology should reduce the time you spend calculating and increase the time you spend deciding what to teach next based on what the data shows. A tracking tool that takes longer to update than it saves you in analysis isn’t solving the actual problem.
Adjusting Growth Goals for English Learners and Students With Disabilities
Growth goals for English learners and students with disabilities need the same rigor as any other student’s goal, built around a target that reflects their actual starting point rather than a grade-level assumption that doesn’t account for language acquisition timelines or documented learning needs.
For English learners, separate language proficiency growth from content-area growth wherever possible. A student can show strong growth in scientific reasoning while their formal written English is still developing, and a single content-area writing rubric can hide that progress entirely. Where possible, offer an alternate demonstration format (oral explanation, labeled diagram, native-language response translated afterward) alongside the standard measure, so the growth goal captures content understanding without over-penalizing language development that’s on its own separate trajectory.
For students with disabilities, growth goals should align with, and ideally reinforce, IEP goals rather than run as a separate, disconnected target. If a student’s IEP already includes a specific reading fluency or math computation goal, build your instructional unit’s growth goal around that same skill and measure rather than introducing a third, unrelated metric. Loop in the special education team when setting tiered targets for these students. Their documented present levels of performance are often the most accurate baseline data you’ll have access to, and involving them early avoids setting a target that conflicts with accommodations already in place.
Unit Cycles or Year-Long Goals: My Take on Which One to Use
Most schools default to year-long growth goals because that’s what state reporting requires, and I understand the administrative logic. But if your actual purpose is improving instruction, not just satisfying a compliance form, unit-based cycles win almost every time.
A year-long goal gives you one data point to learn from. A unit-based approach, repeated four to six times across a school year, gives you four to six chances to test an instructional strategy, see whether it worked, and adjust before the next cycle starts. That’s the entire logic behind short instructional-improvement cycles: plan, measure, reflect, repeat, fast enough that the lesson from cycle one actually changes what you do in cycle two.
Year-long goals still have a place. District reporting requirements, some state SMART goal frameworks tied to the academic year, and multi-year initiatives genuinely need that longer horizon to show their full effect. Use both. Set the year-long goal because your state or district frameworks require it, and stack unit-based cycles underneath it as the actual engine of your instructional decisions. Treat the annual number as documentation, not as your primary learning tool. The unit cycles are where you actually get better at teaching.
— Brian Koster, Ed.D.
How Empowered Professional Learning Helps You Put This Into Practice
Writing a strong growth goal is one skill. Choosing the right measures, designing accessible assessments, and keeping students motivated through the whole unit are three more, and most PD programs cover them separately, in generic sessions that don’t connect back to your actual classroom. Empowered Professional Learning built its courses around the opposite approach: narrow, practical, and immediately usable the same week you take them.
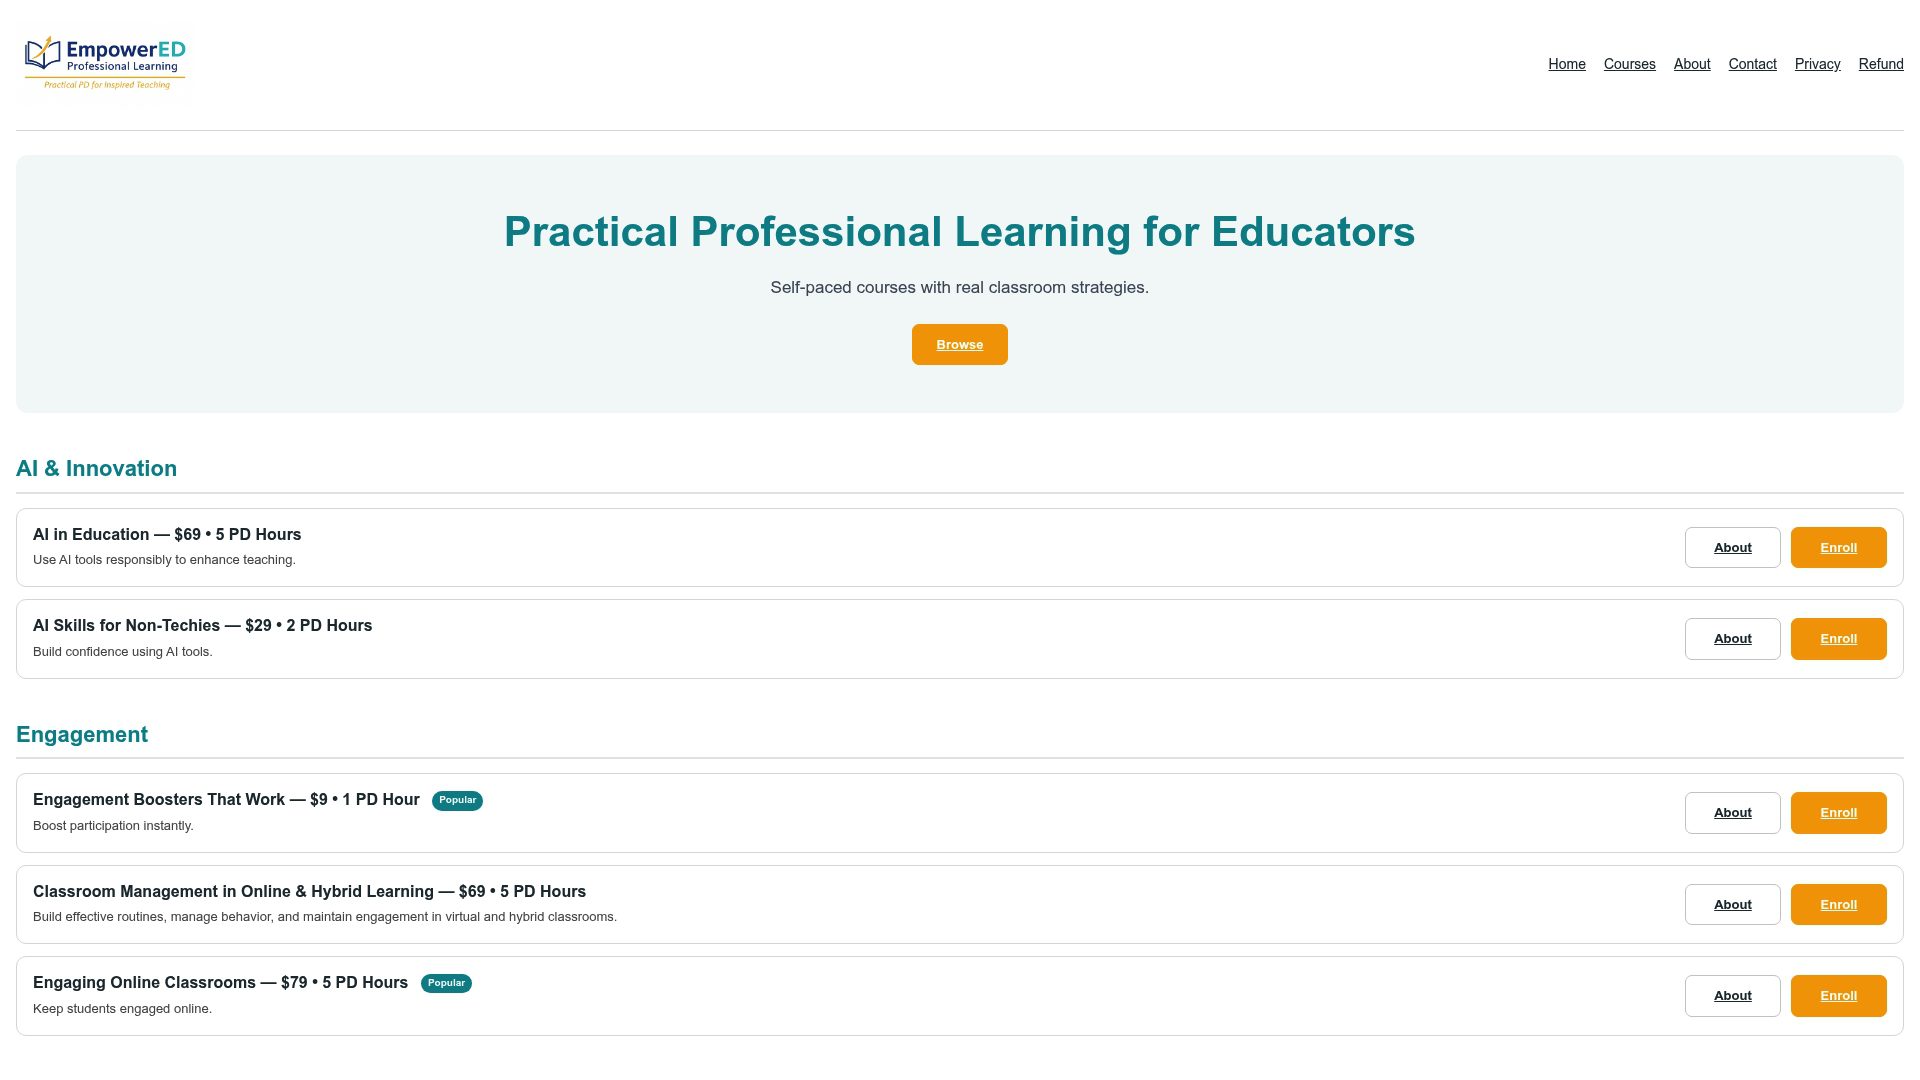
If measurement is your gap, Data Literacy for Teachers teaches you to choose aligned measures and read trend-line data without a statistics background, for $79. If your growth goals need to reach students across a wide range of needs, Universal Design for Learning (UDL) & Accessibility covers accessible assessment design for $79, and Social-Emotional Learning & Teacher Wellness addresses the SEL side of growth tracking covered earlier. Math teams looking to strengthen how students demonstrate growth on reasoning-based tasks can start with Mathematical Thinking for Teachers for $49.
Courses work as individual PD, a grade-level team pilot, or a bulk license for a full department or school. A practical next step: pilot one unit this semester using Data Literacy for Teachers alongside your existing assessment plan, and see how the trend-line habit changes your mid-unit decisions. Browse the full course list at Empowered Professional Learning’s professional learning catalog to find the right starting point for your team.
Key Resources for Building Growth Goal Templates and Rubrics
A handful of primary sources cover almost everything you need to build district-ready templates, rubrics, and monitoring tools from scratch.
- OSPI’s student growth guidance defines student growth measurement and lays out the multiple-measures approach referenced throughout this guide.
- The PVAAS growth goals guide shows how to pair growth goals with achievement targets and use growth reports to prioritize which students need attention first.
- Oregon’s progress monitoring guidance walks through trend-line analysis and the Four-Point Rule in more detail than covered here.
- The REL/IES instructional improvement toolkit includes a downloadable spreadsheet tool for running short pre/post instructional experiments.
Bookmark these alongside your district’s own growth goal template. Between the two, you should have everything needed to build a rubric or checklist for your next unit without starting from a blank page.
Sources
- Student Growth (OSPI)
- PVAAS growth goals guide (Pennsylvania)
- Progress monitoring guidance (Oregon Department of Education)
- Instructional improvement toolkit (REL/IES)
FAQ
What are some examples of growth goals?
A growth goal names a specific skill, a baseline, and a target tied to a defined timeframe, such as “80% of students will score at least 75% on the unit assessment, up from a 52% average on the pre-assessment.” Effective examples span content areas, from writing rubric gains to attendance improvement to self-regulation growth measured through observation checklists, as shown in the SMART framework section above.
What is a goal for student growth?
A student growth goal targets the change in a student’s performance between two points in time, rather than a fixed proficiency score. The OSPI framework defines it this way and recommends measuring that change using multiple sources of evidence, not a single test.
What are some good personal growth goals for students?
Strong personal growth goals for students often combine an academic skill with a self-regulation or engagement component, like persisting through a difficult problem for a set time before asking for help. Building in student self-assessment, where students track their own progress against the same rubric a teacher uses, tends to increase how invested students are in reaching the target.
What are the 5 SMART goals for students?
SMART is a framework, not five separate goals: Specific, Measurable, Attainable, Relevant, and Time-bound. Applied to student growth, it means naming an exact skill, choosing a way to measure it, setting a realistic target based on baseline data, tying it to a standard you’re already teaching, and giving it a clear start and end date, ideally matched to one instructional unit.
How much does Empowered Professional Learning’s data literacy course cost?
Data Literacy for Teachers is priced at $79 as a one-time purchase, covering how to choose aligned measures and read progress data without a statistics background. It’s designed for individual teachers or grade-level teams working through exactly the measurement challenges covered in this guide.