A classroom data wall is worth building only when it tracks one tightly scoped instructional question, gets updated on a short cycle, and protects student privacy by defaulting to staff-only viewing. If a display cannot meet all three conditions, a secure digital dashboard is the safer choice. Used well, data walls sharpen instructional focus fast; used carelessly, they turn into stale wallpaper or a source of quiet shame for struggling students.
TL;DR:
- A classroom data wall is most effective when it tracks one clear instructional question, is updated weekly, and remains staff-only to protect student privacy.
- Using digital dashboards or hybrid analog-digital setups can improve security and reduce manual updating time, especially when managing multiple measures.
- Data thresholds should be calibrated regularly based on standards and revisited each quarter to ensure relevance, with frequent checks to prevent data from becoming stale.
- Data walls should influence next steps by supporting short, focused routines like targeted group reteaching and student goal conferences.
- Prioritizing instruction and privacy over format or decoration increases the likelihood that data walls lead to meaningful instructional improvements.
Table of Contents
- What Is a Data Wall in the Classroom?
- Quick-Start Checklist: Build a Useful Data Wall in One Planning Session
- Choosing Measures, Assessments, and Proficiency Thresholds
- Analog, Digital, and Hybrid Display Options
- Turning Wall Data Into Instruction: Meetings, Interventions, and Student Goals
- Privacy, Equity, and Ethical Considerations
- Common Mistakes, Quick Fixes, and Pro Tips
- Building the Skills Behind a Successful Data Wall
- Why the Conventional Data Wall Advice Falls Short
- Guided PD for Teams Ready to Build This Right
- Sources
- FAQ
What Is a Data Wall in the Classroom?
A data wall is a physical or digital display that tracks student performance on a specific set of measures, usually organized by name, group, or anonymized code, so teachers can see patterns at a glance. Most K-12 versions live on a wall near a teacher’s desk or in a shared planning room, built from sticky notes, magnets, or color-coded cards.
The format matters less than the function. A systematic review of teacher and student affective responses found that 73% of respondents reported heightened awareness of achievement issues after using data walls, and 55% said the displays helped them analyze evidence of student learning.
Classroom performance boards work the same way as data walls, just under a friendlier label. Whatever term your school uses, the design rules below apply.
Quick-Start Checklist: Build a Useful Data Wall in One Planning Session
You do not need a committee or a redesign of your gradebook to start. A single 45-minute planning block is enough if you follow these steps in order.
- Pick one instructional question. Something like “Are students mastering fraction equivalence by the end of the unit?” works better than a wall tracking five unrelated skills at once.
- Choose one or two aligned measures. Match each measure directly to that question. Reject anything you cannot connect to it in one sentence.
- Select a fast formative assessment. Exit tickets, short standards-aligned quizzes, or quick checks you can score same-day keep the data current.
- Set thresholds and a simple visual code. Three color bands (mastered, approaching, not yet) beat a ten-point scale nobody can read at a glance.
- Decide the audience and update cadence. Staff-only by default; weekly updates for most formative measures.
- Assign roles. Name who updates the wall and who leads the five-minute discussion each week, so it does not fall on one person indefinitely.
Pro Tip: Build the wall around the assessment you already give, not a new one. Adding a fresh quiz just to feed the wall is the fastest way to abandon it by October.
Choosing Measures, Assessments, and Proficiency Thresholds
Anchor every data wall to explicit standards or learning targets, never to course grades. A grade blends behavior, effort, and content mastery into one number that hides exactly the instructional signal a data wall is supposed to surface.
Frequent formative checks work better than unit tests for this purpose. Exit tickets, short standards-aligned items, and quick skill probes give you a data point every few days instead of every few weeks. That frequency is what keeps the display relevant.
Setting thresholds takes a bit of calibration:
- Use a rubric or common benchmark band (e.g., 80% or higher on a standards-aligned check counts as “mastered”).
- Cross-check the threshold against a colleague’s grading on the same rubric before locking it in.
- Revisit thresholds each quarter, since a bar that worked in September may need adjusting by January.
Practitioner critiques of analog data walls point out that stale data is one of the fastest ways to lose staff buy-in. If the numbers on the wall are three weeks old, teachers stop trusting them, and the wall becomes decoration instead of a planning tool.
Analog, Digital, and Hybrid Display Options
Analog walls (sticky notes, laminated cards, magnetic tiles) are cheap, fast to build, and easy for a team to update during a five-minute huddle. Their weakness is security: anyone walking down the hallway can see them, and updating them by hand eats planning time every single week.
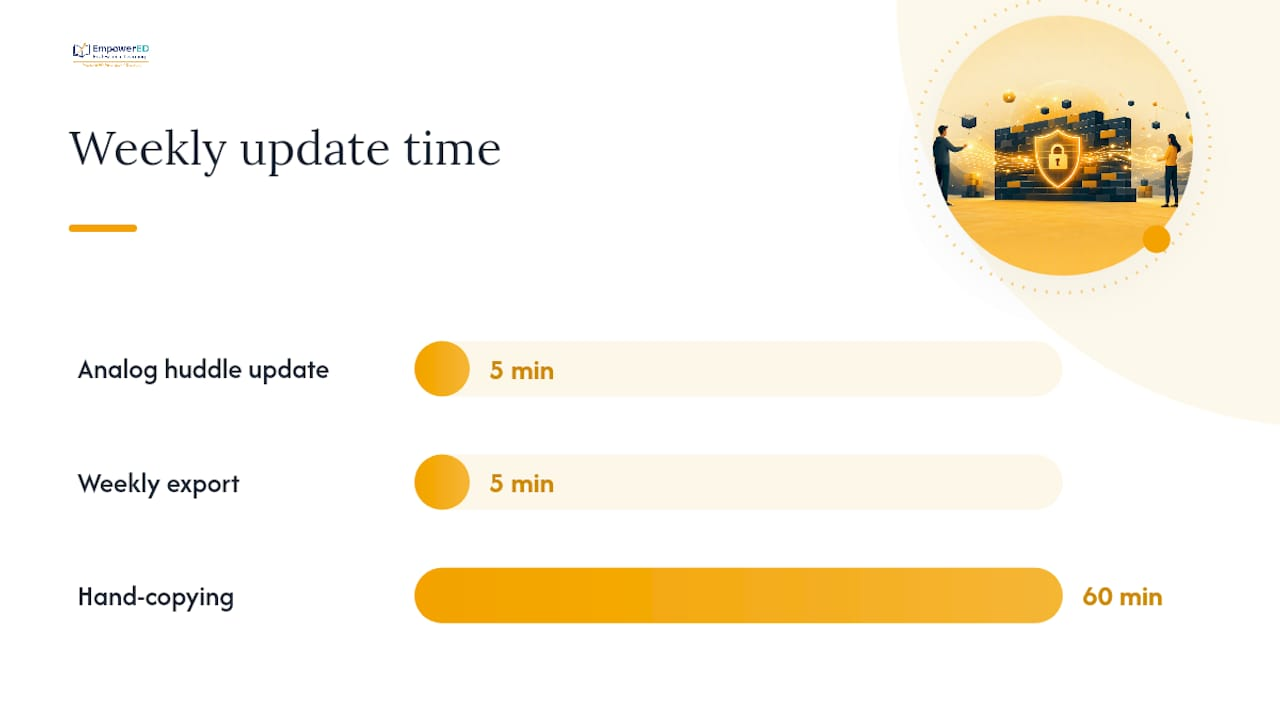
Digital dashboards solve the visibility problem and often sync automatically with your gradebook or assessment platform, but they take more setup effort and can bury the single metric that mattered in a wash of extra data. Automating updates or minimizing manual copy tasks is consistently the highest-yield efficiency change teachers can make when they move away from hand-updated walls.
A hybrid approach often works best for a single classroom:
- Keep a simple analog board in a staff-only planning room for weekly team conversations.
- Export or screenshot the same data into a private digital folder for your own reference between meetings.
- Use anonymized codes instead of names on anything visible to students or visitors.
- Move to a secure student data platform once you are tracking more than two or three measures at once.
Pro Tip: If your school already has a gradebook system with export functions, a five-minute weekly export beats an hour of hand-copying every time. Print-to-laminate templates work fine for the display itself, but let the data feed come from wherever it already lives.
Turning Wall Data Into Instruction: Meetings, Interventions, and Student Goals
A data wall only earns its wall space if it changes what happens in the next lesson. That means building a short, structured routine around it rather than letting teachers glance at it in passing.
- Run a 10 to 15 minute PLC check-in focused on one instructional question at a time. Longer meetings tend to drift into unrelated topics.
- Group students by pattern, not by name. If six students missed the same skill, that is a small-group reteach, not six individual conferences.
- Hold brief student goal-setting conferences using the wall’s data as a conversation starter, not a public ranking. A script as simple as “Here is where you are, here is the next target” works for most grade levels.
- Time-box the routine and assign roles so data review does not expand to eat an entire planning period.
Case-study evidence backs the collaboration piece specifically: teachers using data walls report the format supports productive team conversation, though many say the walls alone do not automatically build confidence in applying that data to daily instruction. The wall starts the conversation; the protocol is what makes it useful.
Privacy, Equity, and Ethical Considerations
Visible data can motivate a student or quietly shame one, and the difference comes down to design choices, not intent. A review of 30 empirical studies on data wall use found genuinely mixed emotional responses among both teachers and students, with privacy concerns rising sharply whenever individual students were identifiable on the display.
Researchers describe a “panoptic effect” when performance data links directly to a student’s identity in a space others can see. That surveillance-like dynamic can undercut the very motivation a data wall is meant to build.
Data displays should emphasize growth and next steps rather than static labels. A student who moved from “not yet” to “approaching” needs to see that movement reflected, not just a fixed category that never seems to change.
A few concrete safeguards limit the risk:
- Default to staff-only displays for anything tracking individual students by name.
- Use anonymized codes or growth bands if any display will be visible to students.
- Tell families plainly what data you collect, how you use it, and how long you keep it.
- Avoid single-metric labeling. Pair any performance snapshot with a note on trend or growth.
Student-facing dashboards work best when they give students some control over what they see, such as toggling which goal displays or choosing what stays private.
Common Mistakes, Quick Fixes, and Pro Tips
The most common failure is tracking too much. A wall trying to show reading level, behavior points, and math fluency at once ends up telling teachers nothing clearly. Narrow it to one instructional question and resist the urge to add “just one more column.”
Stale data is the second failure. If updates happen monthly instead of weekly, shorten the cycle or move the feed to a digital export that updates itself.
- Limit every wall to one or two measures tied to one instructional question.
- Shorten the update cycle rather than adding more data points.
- Digitize the data feed if manual copying is eating more than 15 minutes a week.
Pro Tip: Pair an anonymized trend visual for staff meetings with a private, individual goal sheet for each student. You get the pattern-spotting power of a group view without putting any single student’s name on a wall others can read.
Maintain the wall on a recurring calendar reminder, not memory. A wall nobody updates for a month is worse than no wall at all, since stale data can quietly steer instruction in the wrong direction.
Building the Skills Behind a Successful Data Wall
This playbook draws on peer-reviewed research into the affective and instructional impacts of classroom data walls, along with practitioner critiques of analog display practices in K-12 settings. The consistent thread across that research: displays succeed or fail based on design discipline and staff training, not the format itself.
Short, targeted professional development measurably improves whether teachers use data to guide instruction rather than to sort or rank students. Practical training closes the gap between “we have a wall” and “we use the wall to change tomorrow’s lesson.”
- Data Literacy for Teachers builds the interpretation skills behind reading and acting on wall data correctly.
- Data-Informed Staff Professional Development for K-12 Schools helps entire teams build shared protocols for data conversations.
- Universal Design for Learning (UDL) & Accessibility supports building displays and goal-setting conversations that work for neurodiverse learners too.
Teams that pair a clear setup checklist with this kind of focused training tend to sustain the practice past the first grading period, instead of letting the wall quietly go stale by winter break.
Why the Conventional Data Wall Advice Falls Short
Most guidance on classroom data walls treats them as a display problem: pick a template, laminate some cards, done. That misses the actual failure point. The research consistently shows the wall itself is neutral. It is the update cadence, the audience, and the number of metrics crammed onto it that determine whether it helps or hurts.

The advice to “make data visible” also gets repeated far more often than the advice to protect it. Visibility and motivation are not the same thing, and a wall that exposes a struggling student’s name to classmates can do real damage even when the teacher’s intent is purely encouraging. That is the piece conventional advice glosses over.
If you take one thing from this, prioritize the instructional question first and the display format last. A single laminated card tracking one skill, updated weekly, and shown only to staff will outperform a colorful, multi-metric wall that nobody trusts by November. Build the habit of a short weekly data conversation before you build anything decorative, and treat student privacy as a design constraint from the very first planning session, not an afterthought you bolt on later.
— Brian Koster, Ed.D.
Guided PD for Teams Ready to Build This Right
Setting up one data wall is a planning session. Sustaining a school-wide practice that stays privacy-first and instructionally focused is a training problem addressed by specialized professional development courses that focus on strategies applicable in classrooms quickly.
Data Literacy for Teachers walks teams through exactly the measure-selection and threshold-setting skills this article covers, for 79 USD one-off. For broader implementation support, Data-Informed Staff Professional Development for K-12 Schools helps entire staff build shared data protocols instead of leaving each teacher to improvise. Both courses include personalized instructor feedback and a certificate that may qualify for PD credit.
Schools and districts considering a pilot for their instructional coaches or grade-level teams can review the full course catalog on the professional learning page, where bulk licensing options are available alongside individual enrollment. Request a team quote or start with a single course to see how it fits your school’s data practices before committing districtwide.
Sources
- Using Data Walls to Display Assessment Results: A Review of Their Affective Impacts on Teachers and Students
- Using Data Walls to Display Assessment Results: A Review of Their Affective Impacts on Teachers and Students (ERIC EJ1253581)
- It’s Time to Ditch the Data Wall
- Ethical concerns and suggested mitigation strategies related to student-facing learning analytics dashboards – a narrative literature review
FAQ
What Is a Data Wall?
A data wall is a physical or digital display, often organized by student name, code, or group, that tracks performance on a specific set of measures so teachers can spot patterns quickly. Research on its affective impacts shows the format works best when it tracks one instructional question and stays staff-only when individual students are identifiable.
What Is the 70/30 Rule in Teaching?
It is not a data-wall-specific rule, but it does support the same principle behind effective data walls: frequent, low-stakes practice generates the formative data a wall needs to stay current.
Is Tracking Student Data in Education Illegal?
Tracking student performance data is a normal, legal part of K-12 instruction, but schools must handle personally identifiable information carefully and disclose data practices to families. The concern with data walls specifically is not legality but exposure. Displays that make individual students’ results visible to peers raise privacy and equity concerns that research on learner dashboards recommends mitigating through anonymization and opt-in controls.
What Do Teachers Do With the Data They Collect?
Teachers use classroom data to group students for targeted instruction, adjust pacing, and set individual goals with students during short conferences. The research on data wall use in teaching shows this works best when paired with a structured routine, like a short weekly PLC check-in focused on one instructional question, rather than leaving teachers to interpret the wall on their own.
How Often Should a Classroom Data Wall Be Updated?
Weekly updates work well for most formative measures, since that cadence keeps the data current without creating a heavy maintenance burden. Practitioner critiques of stale analog walls recommend shortening update cycles or digitizing the data feed whenever manual updates start eating more than 15 minutes a week.