Use a focused question and a short data cycle: collect, prepare, interpret, act. Start this week by examining one quick data source, such as last unit’s quiz or a formative exit ticket. The What Works Clearinghouse practice guide frames this as an ongoing, cyclical process, and short professional learning options from EmpowerED Professional Learning can build this skill in under an hour.
TL;DR:
- Teachers should focus on one clear question and a single quick data source each cycle to ensure accurate interpretation and effective instructional adjustments.
- Decision rules such as reteaching students below benchmark and grouping students by skill level should be applied consistently to streamline data-driven instruction.
- Regular short checks, paired with one monthly assessment, provide enough signals to modify teaching strategies without overwhelming teachers with paperwork.
- Using simple, quick-to-update visuals like color-coded data walls or dashboards helps facilitate rapid interpretation and maintains student privacy.
- Building a clear team structure with designated roles and routine meetings supports sustained use of student data and supports continuous improvement.
Table of Contents
- A step-by-step data cycle teachers can follow this week
- Practical classroom protocols: decision rules, grouping, and short-cycle monitoring
- Tools and visuals that speed interpretation: data walls, dashboards, and simple templates
- Building a data-driven culture: roles, routines, and professional learning
- Privacy and legal basics for classroom data
- Quick templates and short routines teachers can copy and adapt
- Common challenges and limitations in analyzing student data
- Best practices for ensuring data accuracy and quality
- Ethical considerations beyond privacy in data interpretation
- Case studies or examples illustrating effective student data analysis
- Strategies for communicating findings to stakeholders
- What matters most when time is short
- How EmpowerED Professional Learning can help you build this skill
- Sources
- FAQ
A step-by-step data cycle teachers can follow this week
Analyzing student data works best as a repeatable routine, not a one-time event. The WWC practice guide describes this as a cycle: collect and prepare data from multiple sources, interpret it to form hypotheses, implement instructional changes, then monitor results. Here is how to run that cycle in one planning period.
- Write one focused question tied to a specific standard or learning target, such as “Which students still struggle with multi-step word problems?”
- Pick one fast data source that answers that question, like a recent quiz, an exit ticket, or a homework set.
- Prepare the data by sorting scores into simple bands and separating by relevant subgroups so comparisons are fair.
- Interpret the pattern by checking two or three student work samples, not just the score, to form a testable hypothesis about the cause.
- Act with one small instructional change, such as a five-minute reteach or a targeted small group, and set a date to check progress.
The whole cycle can run in under thirty minutes once the habit sticks. Skipping the “prepare” step is common and it is where most misreadings of data happen, since raw scores without context often hide who actually needs help.
Practical classroom protocols: decision rules, grouping, and short-cycle monitoring
Decision rules turn data into action without requiring a meeting every time. Set them once, then apply them consistently.
- If a student scores below benchmark on a quick check, provide a 15-minute reteach that same week.
- If a student is one to two months behind on a skill, place them in a targeted small group for focused practice.
- If a student meets or exceeds the goal on two consecutive checks, move them to an extension task or a new group.
- Recheck every group after one week using a short formative task, not a full test.
- Document only what changes: the group name, the goal, and the date of the next check.
Keep groups flexible. A student who needed support in September on fractions may not need it in November on decimals, so groups should shift with the data rather than stay fixed for a semester.
Pro Tip: Keep groups fluid and focused on a single goal at a time. Chasing multiple goals per group multiplies your tracking work without improving outcomes.
A monitoring rhythm of weekly quick checks paired with one monthly interim assessment gives enough signal to adjust without drowning in paperwork.
Tools and visuals that speed interpretation: data walls, dashboards, and simple templates
A data wall or dashboard only helps if it is fast to update and safe to display. The goal is a quick visual scan, not a spreadsheet marathon.
- Use de-identified progress bands (such as color-coded tiers) instead of student names on any wall visible to others.
- Build a minimum dashboard with just three columns: current skill, band or tier, and next check date.
- A basic spreadsheet is enough for most classrooms; dedicated software is optional, not required.
- Set aside one planning period to build the initial wall or spreadsheet, then update it in five minutes per week.
EmpowerED offers a short, practical walkthrough for building a privacy-first data wall in about 45 minutes, which covers exactly this kind of setup for K-12 classrooms.
Building a data-driven culture: roles, routines, and professional learning
Individual habits fade without team structure. The Carnegie Foundation’s guidance on practical measurement points to analytic infrastructure, meaning roles, routines, and tools, as the backbone of sustained data use.
- Assign clear roles: a classroom teacher who owns daily checks, a coach who supports interpretation, and a data lead who maintains shared systems.
- Schedule short data huddles weekly and a longer common planning session monthly to review trends across classrooms.
- Favor micro-modules and job-embedded coaching over long workshops, since short practice paired with real classroom tasks builds skill faster.
- Review how new tools or materials fit with existing systems, since the RAND report on instructional materials finds that coherence with professional learning and assessment systems predicts better adoption.
EmpowerED’s course on data-informed staff professional development is built around these same short, team-based practice sessions.
Privacy and legal basics for classroom data
Displaying or sharing student data comes with real obligations. The FERPA guidance portal from the U.S. Department of Education sets expectations for how student records are governed, including when written agreements or de-identification are required.
- De-identify any data visible to students, parents, or other staff who do not need names attached.
- Limit personally identifiable information to the smallest group that needs it for instructional decisions.
- Use only district-approved tools and vendors, and confirm a written agreement is in place when a third-party platform stores student records.
- Check with your district’s data privacy officer before adopting a new dashboard or app for classroom use.
Model written-agreement checklists and further detail are available directly through studentprivacy.ed.gov.
Quick templates and short routines teachers can copy and adapt
These are ready to use tomorrow with no extra planning.
- Five-item decision-rule checklist: define the question, name the data source, set the threshold, name the action, and set the recheck date.
- Ten-minute mini data huddle: two minutes to state the question, five minutes to review one data source together, three minutes to agree on next steps.
- One-week monitoring plan: an exit ticket on day one, a quick formative check on day three, and a short reflection on day five to confirm whether the action worked.
Copy any of these into a shared document and adjust the timing to fit your schedule.
Common challenges and limitations in analyzing student data
Time is the most common barrier. Teachers already manage full days, and adding a data routine without trimming something else usually fails within a few weeks. Starting with one question and one data source, as outlined earlier, keeps the routine small enough to survive a busy month.
Data quality is another persistent issue. Scores from a rushed assessment, a mismatched test format, or an assignment completed under unusual conditions can mislead even a careful teacher. A single low score might reflect a bad day rather than a real gap, which is why checking a second source before acting matters.
Tool fragmentation also slows things down. When a school uses one platform for screening data, another for interim assessments, and a third for daily grades, teachers spend more time exporting and reformatting than interpreting. The RAND report notes that disconnected systems often undermine the intended instructional impact of new tools.
Finally, interpretation without classroom context is a frequent trap. A dashboard can show that a student is behind, but it cannot show whether the cause is a skill gap, an attendance issue, or a language barrier. Pairing any quantitative check with a quick look at student work or a short conversation closes that gap and keeps the analysis grounded in what actually happened in the room.
Best practices for ensuring data accuracy and quality
Accuracy starts before the assessment happens. Give the same directions, the same time limits, and the same format each time a check is used, since small inconsistencies in administration can shift scores enough to change a grouping decision.
Cross-check unusual results before acting on them. If a typically strong student scores far below their usual range, look at the item level: was the question format unfamiliar, or was there a data entry error? A five-minute check here prevents a wrong instructional decision later.
Keep data current. A grouping decision built on a data point from six weeks ago no longer reflects where a student actually is. The weekly and monthly monitoring cadence described earlier exists partly to keep the data fresh enough to trust.
Separate the measure from the stakes. Quick formative checks used for grouping decisions should stay low-pressure, since anxiety around grades can distort results and mask a student’s actual understanding. Building this discipline into a classroom routine, rather than treating it as an occasional audit, is what keeps the whole cycle reliable over a full school year.
Ethical considerations beyond privacy in data interpretation
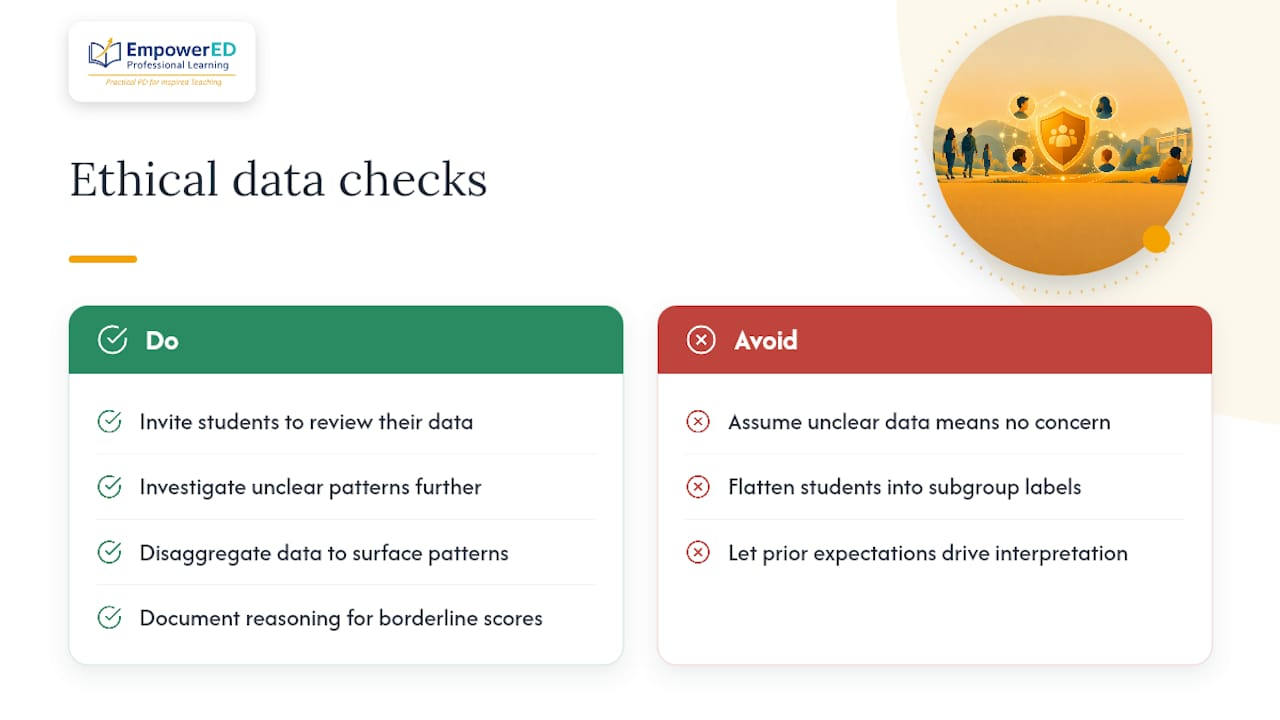
Bias can creep into data interpretation even when the privacy rules are followed correctly. A teacher’s prior expectations about a student can shape how ambiguous data gets read, so a borderline score might get rounded up for one student and down for another without any deliberate intent.
Equity also shows up in which students get flagged for extra support and which get overlooked. Screening tools and quick checks are built for common patterns, and students with inconsistent attendance, multilingual backgrounds, or undiagnosed learning differences can produce data that looks confusing rather than clearly low or high. Treating an unclear pattern as “no concern” rather than investigating it further is a common and avoidable mistake.
Group-level comparisons carry their own risk. Comparing subgroup averages can surface real gaps worth addressing, but it can also flatten individual students into a category that does not reflect their actual needs. The goal of disaggregating data, covered earlier in the data cycle, is to surface patterns worth investigating, not to sort students into fixed labels.
Involving students in understanding their own data, an approach the WWC practice guide specifically recommends, helps counter some of this risk. When students see and discuss their own progress, they can correct a teacher’s misreading and take a more active role in what happens next.
Case studies or examples illustrating effective student data analysis
A middle school math team noticed that quiz scores on a fractions unit varied widely across three classrooms teaching the same lesson. Rather than assuming one teacher was less effective, the team compared item-level results and found that one class had encountered the same problem type in a different format the week before. The fix was a five-minute format review before the next quiz, not a change in teaching approach.
An elementary reading team used weekly progress monitoring checks alongside a monthly interim assessment to track a small group of students flagged during screening. Two students showed steady progress on the weekly checks but flat results on the interim, prompting the team to review classroom work samples. They found the interim’s passage length was the sticking point, not the decoding skill itself, so they adjusted practice materials to build stamina gradually.
A high school team applied a threepart triangulation approach: exit tickets, a unit test, and a short student survey on confidence. The survey revealed several students who scored well on the test but reported low confidence, flagging a group likely to struggle on a cumulative exam later. The team added brief one-on-one check-ins for that group before the next assessment window.
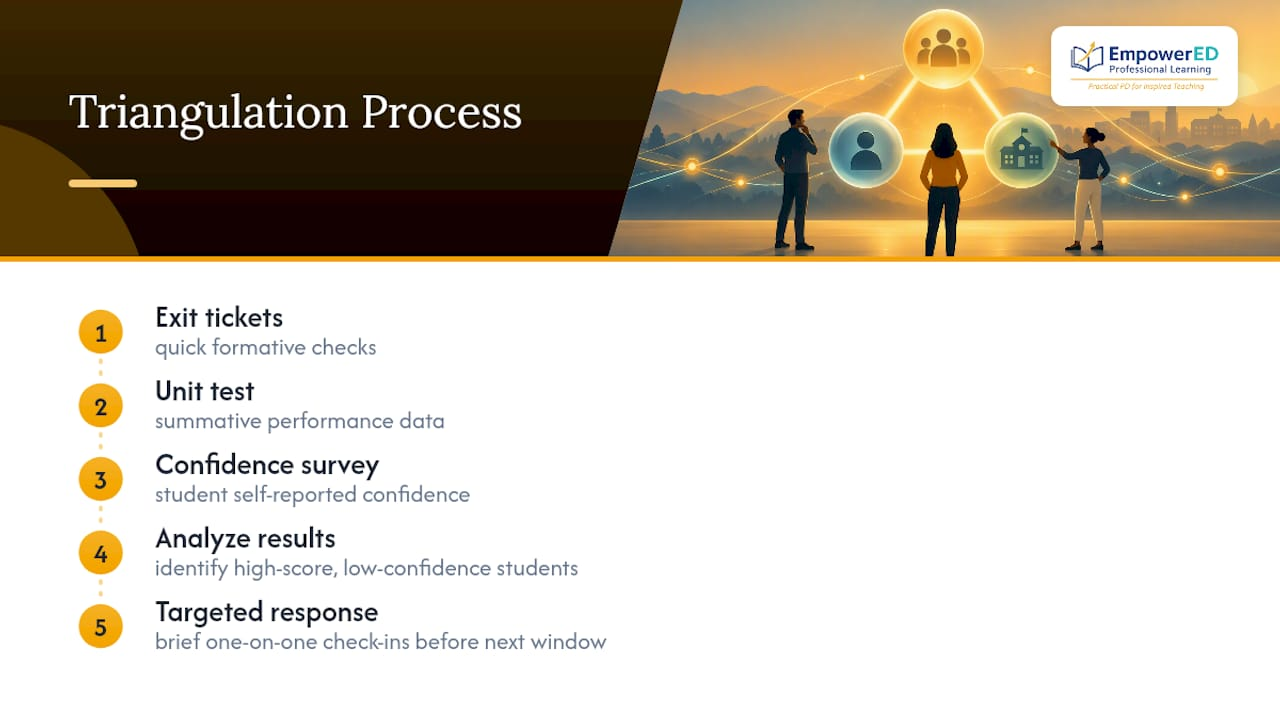
Each example follows the same pattern: one clear question, more than one data source, and a small, specific instructional response rather than a sweeping change.
Strategies for communicating findings to stakeholders
How you share data findings depends on who is listening. Teachers on a grade-level team need specifics: which students, which skill, which action. A short data huddle, using the ten-minute agenda covered earlier, fits this audience well.
Parents need context more than numbers. Rather than leading with a score, describe what their child can do now, what the next goal is, and one thing happening in class to support it. Framing the conversation around growth and next steps, rather than a raw percentile or band, keeps the focus on what parents can actually act on.
Students benefit from age-appropriate transparency. Younger students respond well to simple visual trackers showing progress toward a specific goal, while older students can handle a direct conversation about their own data, including where they stand and what a realistic next target looks like.
School leaders reviewing schoolwide trends need patterns, not individual stories. A brief summary showing which grade levels or subject areas show consistent gaps, paired with what classroom teams are already doing about it, supports better resource decisions than a spreadsheet full of raw scores. Keeping each audience’s format simple and specific to their role reduces confusion and speeds up the response.
What matters most when time is short
Short, disciplined tests beat sweeping data initiatives. A single decision rule, tried for a few weeks and adjusted based on what actually happens in your classroom, teaches you more than a semester of dashboard building. Data should refine your teaching, never replace the judgment you already bring to your students. Pick one rule this month and see what it tells you.
— Brian Koster, Ed.D.
How EmpowerED Professional Learning can help you build this skill
You do not need a semester-long course to get comfortable with the routine described here. EmpowerED Professional Learning offers short, practical courses built by educators, designed to fit into the planning time you already have.
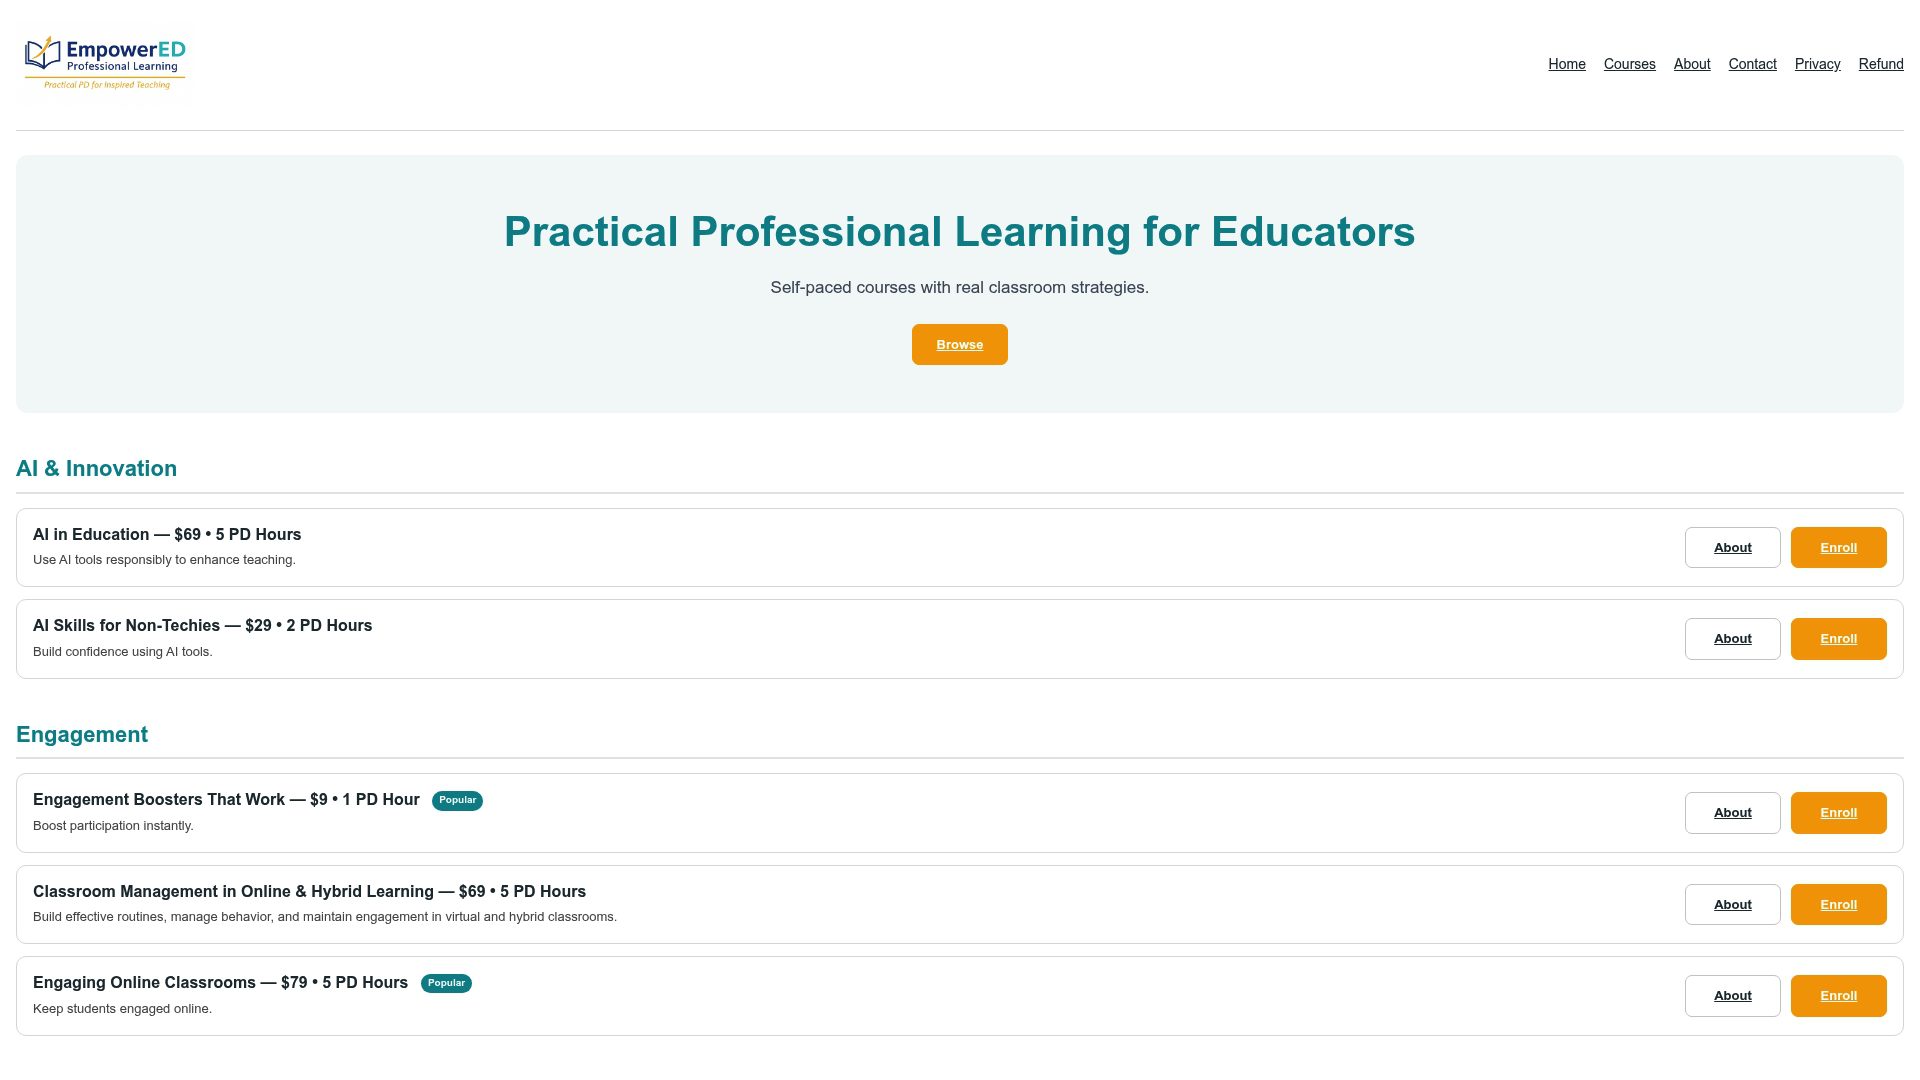
- Data Literacy for Teachers walks through a question-to-action cycle like the one covered in this article, with instructor feedback.
- AI in Education: From Basics to Ethical Integration covers how AI tools can support (not replace) the interpretation work described above.
- Courses can be previewed individually or licensed for a full team, and some include a certificate that may be eligible for PD credit.
Preview the Data Literacy for Teachers course, browse the full professional learning catalog, or check out the AI in Education course to get started this week.
Sources
No single data point tells the whole story. Matching your question to the right data source, and then checking that source against others, protects against false conclusions.
- Using Student Achievement Data to Support Instructional Decision Making (What Works Clearinghouse)
- Measuring to Improve: Practical Measurement to Support Continuous Improvement in Education (Carnegie Foundation)
- Teachers’ Use of Instructional Materials from 2019–2024: Trends from the American Instructional Resources Survey (RAND)
- Studentprivacy
Classroom artifacts frequently carry richer insight than a state score because they show the actual thinking behind an answer, illustrating the importance of engagement and context as discussed in the role of entertainment in learning. When two sources disagree, for instance a strong quiz grade paired with a shaky class discussion, check item-level details and the conditions under which the work was completed before trusting either signal alone.
The WWC practice guide recommends collecting and preparing data from multiple sources before interpreting results, since a single measure rarely captures the full picture of student learning.
FAQ
What is the first step in analyzing student data?
Start by writing one focused instructional question tied to a specific standard, then choose a single fast data source, such as a recent quiz or exit ticket, to answer it. This keeps the process manageable within a single planning period.
How often should teachers check student progress data?
A weekly quick check paired with one monthly interim assessment gives enough signal to adjust instruction without creating excessive tracking work. The WWC practice guide frames this kind of ongoing monitoring as part of the full data-use cycle.
Is it legal to display student data on a classroom wall?
Displaying de-identified progress bands, such as color-coded tiers without names, is a common safeguard used to stay within FERPA expectations. Always confirm specific practices with your district’s data privacy officer and review guidance on studentprivacy.ed.gov.
What is item analysis and why does it matter?
Item analysis means reviewing which specific questions students missed, rather than just the overall score, to understand the actual skill gap. It often reveals whether a low score reflects a real misunderstanding or a format or wording issue unrelated to the skill being tested.
Can short professional development courses actually improve data skills?
Short, practice-based courses that pair a focused module with an immediate classroom task tend to build usable skill faster than long workshops disconnected from daily practice. EmpowerED Professional Learning’s Data Literacy for Teachers course is built around this kind of immediately applicable practice.