The most effective visual learner strategies are concept maps, dual-coding, color-coding systems, sketch-noting, process diagrams, image-based flashcards, timeline visuals, and visual mnemonics. Use this one-week starter plan to put three of them into practice immediately.
Highest-impact strategies at a glance:
- Concept maps and mind maps
- Dual-coding (pairing written notes with quick sketches)
- Color-coding and highlighting systems
- Sketch-noting during lectures or reading
- Process diagrams and flowcharts
- Image-based flashcards
- Timeline visuals for sequential content
- Visual mnemonics (method of loci, imagery-based memory cues)
One-week starter plan:
- Monday: Draw a simple concept map for one topic you are currently studying. Use three to five connected nodes.
- Tuesday: Review your notes from yesterday and add a quick sketch or icon next to each main idea (dual-coding).
- Wednesday: Assign a color to each subject or theme and re-highlight your notes using that system.
- Thursday: Create five image-based flashcards for vocabulary or key concepts. Draw or paste a small image on each card.
- Friday: Sketch a one-page timeline or flowchart summarizing the week’s content.
- Weekend: Review all five flashcards using spaced repetition (review again in two days, then four days).
One important note: the strategies above work because they engage active processing, not because they “match” a fixed learning style. Research covered later in this article explains why the learning-styles matching idea lacks strong support, and why these techniques benefit most learners.
Key Takeaways
Visual strategies are most effective when combined with scaffolding, retrieval practice, and multimodal instruction rather than used as a style-matched accommodation.
| Point | Details |
|---|---|
| Top strategies to start with | Concept maps, dual-coding, color-coding, and image flashcards offer the fastest return for most learners. |
| Research caveat on style-matching | No reliable evidence supports matching instruction to self-reported learning style; multimodal and UDL approaches are recommended instead. |
| Scaffolding is required | 59% of effective visual-intervention studies included structured student support; visuals alone do not guarantee learning. |
| UDL accessibility checklist | Use captions, high-contrast palettes, text equivalents, and tactile alternatives to make visual materials accessible to all students. |
| Empowered Professional Learning | The UDL & Accessibility and Engagement Boosters That Work courses provide structured, certificate-bearing PD for implementing these strategies in K-12 classrooms. |
Table of Contents
- What does being a “visual learner” actually mean?
- How do you know if visual strategies will help you?
- Step-by-step visual strategies every student should try
- How teachers can build visual strategies into everyday lessons
- Which tools and templates make visual strategies easier to use?
- What does the research actually say about visual learning?
- A 4-week plan for building strong visual study habits
- Common mistakes with visual strategies and how to fix them
- Why visual strategies work best when they are part of a larger design
- Deepen your practice with Empowered Professional Learning
- Sources
What does being a “visual learner” actually mean?
A “visual learner” is a person who finds it easier to understand and remember information when it is presented in a visual format: diagrams, charts, maps, color-coded notes, or images. That is a useful self-observation. It is not, however, a fixed neurological category that requires a teacher to deliver every lesson in pictures.
The distinction matters. Preferring visuals describes a tendency, not a measurable learning advantage that disappears when text or audio is used. A 2024 meta-analytic review found no reliable evidence that matching instruction to a student’s self-reported learning style improves outcomes. A separate 2024 experimental study with prospective teachers found no interaction between learning-style preference and presentation mode on learning outcomes.
What the research does support is using visuals as one mode among several, which is the core of multimodal instruction and Universal Design for Learning.
Behaviors that often lead a student or teacher to try visual strategies:
- Gravitating toward diagrams and charts when reading a textbook
- Struggling to follow a long verbal explanation without a written or drawn reference
- Remembering faces, maps, and spatial layouts more easily than spoken lists
How do you know if visual strategies will help you?
Students who benefit most from visual strategies tend to share a few recognizable traits.
Common characteristics:
- Thinks in images or mental pictures when solving problems
- Prefers diagrams, graphs, and charts over dense paragraphs
- Organizes notes spatially (arrows, boxes, clusters) rather than in linear lists
- Remembers where information appeared on a page or slide
- Loses track of spoken instructions but follows written or drawn ones easily
Benefits of using visual strategies:
- Supports pattern recognition across large amounts of content
- Creates memory anchors tied to spatial position or color
- Helps organize complex information into manageable structures
- Makes relationships between ideas visible and easier to review
Quick self-check (answer yes or no):
- Do you frequently sketch or doodle to help yourself think through a problem?
- Do you remember diagrams or charts from class more clearly than what was said about them?
- Do you find it easier to study from color-coded or visually organized notes than from plain text?
Two or three “yes” answers suggest that prioritizing visual study techniques is a reasonable starting point.
Pro Tip: Even if you answered “no” to all three, visual strategies like concept maps and dual-coding are backed by evidence for broad learner populations, not just self-identified visual learners. They are worth trying regardless.
Step-by-step visual strategies every student should try
These nine techniques are ranked by how quickly a student can begin using them with minimal preparation. Each includes a brief example showing the method applied to a real study task.
-
Concept maps and mind maps. Place the central topic in a circle at the center of a blank page. Draw branches to subtopics, then add smaller branches for supporting details. Connect related branches with labeled arrows. Example: A student studying the American Civil War places “Civil War” at the center, branches to “Causes,” “Key Battles,” and “Outcomes,” then links “Emancipation Proclamation” under both “Causes” and “Outcomes” with an arrow labeled “turning point.”
-
Dual-coding. Write your standard notes, then go back and add a small sketch, icon, or diagram next to each main idea. The combination of words and images creates two memory pathways for the same content. Example: Next to a note about mitosis, draw a simple four-panel cell-division sequence.
-
Color-coding and highlighting systems. Assign one color per category before you start (blue for definitions, yellow for examples, pink for dates). Apply consistently across all notes for a unit. Avoid highlighting everything, which removes the signal. Example: A student studying a history chapter uses green for causes, orange for effects, and blue for key figures throughout the entire chapter.
-
Sketch-noting. Replace or supplement standard notes with a mix of words, simple drawings, icons, and spatial layouts on a single page. This works especially well during lectures. Keep drawings simple: stick figures and basic shapes are sufficient.
-
Process diagrams and flowcharts. Use boxes and arrows to map any sequence: a scientific process, a historical chain of events, a math algorithm. Label each step briefly. Example: Map the water cycle as a looping diagram with labeled arrows between evaporation, condensation, precipitation, and collection.
-
Image-based flashcards. On one side of a card, write the term or question. On the other side, draw or paste an image that represents the answer alongside the written answer. Apps like Anki support image attachments and built-in spaced repetition scheduling.
-
Timeline visuals. Draw a horizontal or vertical line and place events or steps at scaled intervals. Use color to group related events. Timelines work for history, literature chronology, and scientific discovery sequences.
-
Visual mnemonics and method of loci. Assign a vivid image to each item you need to remember, then place those images along a familiar mental route (your home, your school hallway). To recall the list, mentally walk the route. This technique is particularly effective for ordered lists and foreign-language vocabulary.
-
Annotating videos and screenshots. Pause a video at key moments and take a screenshot. Annotate it with labels, arrows, and questions using a tool like Google Slides, Notability, or even printed paper. This converts passive viewing into active processing.
Combining strategies with spaced repetition: Visual strategies build understanding; spaced repetition builds long-term retention. After creating a concept map or set of image flashcards, schedule reviews at increasing intervals (one day, three days, one week). Anki automates this scheduling. The combination is more effective than either approach alone.
A systematic review of visual displays in K-12 instruction found that simply adding visuals does not guarantee learning. Many studies of visual interventions included student support, and collaborative concept-map creation showed a large positive effect when paired with feedback and guided practice. The takeaway: use these strategies actively, not passively.
How teachers can build visual strategies into everyday lessons
Effective visual instruction is not about decorating slides with clip art. It is about designing tasks that require students to construct, interpret, and discuss visual representations. The CAST UDL Guidelines recommend providing multiple means of representation so that key information is accessible across modalities, which makes visual strategies a natural fit within a UDL-aligned classroom.
Four ready-to-use activity blueprints
1. Concept-cartoon lesson starter (5 minutes)
Display an image or simple cartoon showing a common misconception about the day’s topic. Ask students: “What do you notice? What do you wonder? What might be wrong here?” Students discuss in pairs, then share out. This activates prior knowledge and surfaces misconceptions before instruction begins.
2. Collaborative concept map routine (15–20 minutes)
Provide small groups with a large sheet of chart paper and sticky notes. Each student writes one idea per note, then the group arranges and connects notes into a shared concept map. Groups compare maps and explain their organizational choices. Research supports this approach: collaborative visual creation, when paired with teacher feedback, produces measurable gains in higher-level thinking.
3. Image-annotate exit ticket (5 minutes)
At the end of a lesson, display a diagram, graph, or image related to the day’s content. Students label three parts, draw one connection arrow, and write one question. Collect as a formative check.

4. Mini-sketchnote gallery walk (20–25 minutes)
Students create a one-page sketchnote summarizing a reading or lesson segment. Post sketchnotes around the room. Students rotate, add a sticky-note comment to two peers’ work, and identify one idea they had not included in their own. This builds visual literacy and peer feedback skills simultaneously.
UDL accessibility checklist for visual materials
When using visuals in instruction, the Texas Education Agency’s UDL guidance recommends the following accessibility practices:
- Provide captions or text equivalents for all visual content
- Use high-contrast color palettes (dark text on light backgrounds, or vice versa)
- Offer tactile alternatives for students with visual impairments (raised-line diagrams, physical models)
- Allow students to adjust font size and image scale in digital materials
- Label all diagrams clearly; never rely on color alone to convey meaning
Scaffolding and differentiation tips
Teach visual conventions explicitly. Many students have never been shown how to read a graph’s axes, interpret a concept map’s hierarchy, or use a flowchart’s decision diamonds. A five-minute “how to read this” mini-lesson before a visual task removes a significant barrier.
For students with reading differences, pair visual tasks with verbal explanation rather than written instructions. For students with low vision, provide enlarged print versions and tactile models. Visual Thinking Strategies (VTS) offers a low-prep, discussion-based routine that aligns with UDL by valuing multiple perspectives and enabling students to practice visual analysis through open-ended questions about images.
Pro Tip: Before any visual task, model your own thinking aloud as you interpret or create the visual. Students who have never seen an expert “think through” a diagram often do not know where to start.
Which tools and templates make visual strategies easier to use?
Both digital and low-tech options work well. The right choice depends on access, grade level, and whether the task is individual or collaborative.
| Tool / Material | Type | What it does | Best use case |
|---|---|---|---|
| Canva (free tier) | Digital | Drag-and-drop graphic design with templates | Student infographics, timeline posters, concept maps |
| Google Slides | Digital | Collaborative slide deck with drawing tools | Annotated exit tickets, group concept maps, sketchnote templates |
| Anki | Digital (free) | Spaced-repetition flashcard app with image support | Image-based flashcard review for vocabulary and concepts |
| Notability / GoodNotes | Digital (paid) | Handwriting and annotation on PDFs and screenshots | Annotating lecture slides, sketch-noting on a tablet |
| Pear Deck | Digital | Interactive slides with visual response prompts | Formative checks, image-annotation tasks in class |
| Sticky notes + chart paper | Low-tech | Physical concept mapping and sorting | Collaborative concept maps, gallery walks |
| Index cards + colored pens | Low-tech | Handwritten image flashcards | Vocabulary study, portable review sets |
| Printed graphic organizers | Low-tech | Pre-structured templates (Venn diagrams, T-charts, cause-effect maps) | Guided note-taking, pre-reading scaffolds |
| Colored highlighters (4-color set) | Low-tech | Color-coding in printed texts | Categorizing information in textbooks and handouts |
Classroom setup tips:
- Store colored pens, sticky notes, and index cards in labeled bins at each table cluster for easy access during any lesson.
- Keep a set of printed graphic organizer templates in a shared folder (physical or digital) so teachers can pull one in under a minute.
- For digital tools, establish one or two consistent platforms rather than rotating through many. Familiarity reduces setup time and cognitive load.
For a curated list of classroom-tested options, the top engagement tools for visual learners in K-12 covers additional platforms with specific grade-band recommendations.
What does the research actually say about visual learning?
The short answer: visuals are genuinely useful, but the popular idea that students learn best when instruction matches their self-reported style is not well supported by evidence.
A 2024 meta-analytic review in Frontiers in Psychology found no reliable evidence that matching instruction to a student’s self-reported learning style improves outcomes. A 2020 Frontiers in Psychology review reached the same conclusion and noted that approximately 68% of students in one reviewed study did not have a clear dominant learning-style preference. A 2024 experimental study published in Instructional Science tested the “meshing hypothesis” directly with prospective teachers and found no interaction between stated learning-style preference and presentation mode on outcomes.
What the evidence does support:
- Multimodal instruction (presenting content in multiple formats) benefits a broader range of learners than single-mode delivery
- Scaffolded visual tasks with teacher feedback produce stronger outcomes than unguided visual activities
- Collaborative creation of visuals, when paired with guided practice, can yield large gains in higher-order thinking
- UDL-aligned design, which provides multiple means of representation, is the recommended framework for inclusive visual instruction
Practical implications for classrooms:
- Use visuals as one mode among several, not as the exclusive format for students who self-identify as visual learners
- Teach students how to interpret and create visuals explicitly; do not assume visual literacy is automatic
- Pair visual tasks with retrieval practice (low-stakes quizzes, self-testing) to consolidate long-term memory
- Apply UDL accessibility guidelines to every visual resource: captions, text equivalents, high contrast, and tactile alternatives
| Research finding | Source | Implication |
|---|---|---|
| No reliable evidence that style-matching improves outcomes | Frontiers in Psychology (2024 meta-analysis) | Use multimodal instruction for all students |
| ~68% of students lack a clear dominant learning-style preference | Frontiers in Psychology (2020 review) | Avoid sorting students into fixed style categories |
| 59% of visual-intervention studies included student support | Boise State University review (K-12 visual displays) | Scaffold all visual tasks; do not assign and walk away |
Key finding: Multimodal instruction and UDL-aligned design are what the evidence supports, not style-matched delivery.
A 4-week plan for building strong visual study habits

This plan is designed for students who want to move from occasional use of visual strategies to a consistent, scheduled routine. Each week has a single focus.
Week 1: Introduce the techniques
- Choose two strategies from the list above (concept maps and color-coding are good starting points).
- Apply both to one subject only this week.
- Daily micro-session (10–15 minutes): draw or update a concept map for the day’s content; apply your color-coding system to new notes.
- At the end of the week, review your concept map and add any missing connections.
Week 2: Practice creation
- Add a third strategy (image-based flashcards or sketch-noting).
- Create five image flashcards per study session.
- Daily micro-session (15–20 minutes): sketch-note one reading or lecture segment; create or update flashcards.
- Begin spaced repetition: review flashcards from Week 1 on Days 10 and 13.
Week 3: Combine with retrieval practice
- Before reviewing your notes, close them and try to redraw your concept map from memory.
- Use your flashcards for self-testing, not just review.
- Daily micro-session (15–20 minutes): retrieval attempt first, then check and correct your concept map or flashcards.
- Add a timeline or flowchart for any sequential content in your current units.
Week 4: Refine and schedule
- Identify which two or three strategies produced the clearest improvement in your recall.
- Build a recurring weekly schedule: which strategies you will use on which days for each subject.
- Daily micro-session (10–15 minutes): maintenance review of existing maps and flashcards; create new ones only for new content.
- Adjust the schedule based on upcoming assessments: increase frequency two weeks before a major test.
Tracking progress:
- After each week, rate your recall on a 1–5 scale for the content you studied visually versus content you studied with plain notes.
- Note which strategies felt most natural and which required the most effort. Effort often decreases with repetition.
- For heavy course loads, apply the plan to your most challenging subject first, then expand.
Common mistakes with visual strategies and how to fix them
Visual strategies fail most often not because the technique is wrong, but because of how it is applied.
Dos and don’ts:
- Do keep visuals clean and uncluttered. A concept map with 40 nodes and crossing arrows creates cognitive overload, not clarity.
- Don’t highlight entire paragraphs. Highlighting works only when it marks a small fraction of the text.
- Do use high-contrast color combinations. Light yellow text on a white background is nearly invisible for many readers.
- Don’t rely on visuals alone. Combine them with retrieval practice, verbal explanation, or writing to consolidate learning.
- Do label every part of a diagram. Unlabeled visuals are decorative, not educational.
- Don’t create visuals passively (copying a diagram without thinking about it). Active construction is what drives learning.
Troubleshooting poor retention:
- If a concept map is not helping you remember content, add a retrieval step: close the map and try to redraw it from memory before checking.
- If color-coding feels overwhelming, reduce to two colors until the system becomes automatic.
- If flashcards are not sticking, check whether your images are specific and vivid enough. A generic icon is less memorable than a personally meaningful one.
Accessibility fixes:
- Replace color-only coding with color plus pattern or shape (striped vs. solid, circle vs. square) so the system works for colorblind students.
- Provide printed or enlarged versions of any classroom visual for students with low vision.
- Add captions or written descriptions to all images and diagrams used in instruction, per TEA UDL accessibility guidance.
- For students who cannot access visual materials, offer tactile equivalents (raised-line maps, physical 3D models) alongside the visual version.
Pro Tip: Run a “cognitive load check” on any visual you create or assign: if a student needs more than 30 seconds to understand the structure of the visual before engaging with its content, simplify the layout.
Why visual strategies work best when they are part of a larger design
The most common mistake educators make with visual strategies is treating them as a style accommodation rather than a design principle. A student who says “I’m a visual learner” is not asking for every lesson to be a slide deck. They are signaling that they process information more efficiently when it has spatial structure, color differentiation, or graphic form. That signal is worth acting on, but the response should be multimodal design, not style-matched delivery.
The research is consistent on this point. Visuals work when they are paired with scaffolding, explicit instruction in visual conventions, and retrieval practice. They do not work when they are decorative, unstructured, or used as a substitute for active engagement. The UDL framework from CAST captures this well: the goal is to reduce barriers in the learning environment for all students, not to sort students into categories and teach each category differently.
Teachers who see the strongest results from visual strategies are those who teach students how to use them. A five-minute “how to build a concept map” demonstration at the start of a unit pays dividends for the rest of the year. A gallery walk where students explain their sketchnotes to peers builds both visual literacy and communication skills. These are not accommodations for a subset of learners. They are good instructional design for everyone.
The active learning strategies resource for K-12 teachers offers additional routines that pair well with the visual techniques covered here, particularly for teachers who want to integrate visual tasks into collaborative and discussion-based lessons.
Deepen your practice with Empowered Professional Learning
Teachers who want to move beyond individual techniques and build a fully inclusive, visually rich classroom have a direct path forward. Empowered Professional Learning’s Engagement Boosters That Work course delivers classroom-ready engagement strategies grounded in current research, with immediate application to visual instruction, formative tasks, and student participation. For educators who want structured training on UDL-aligned design and accessibility, the Universal Design for Learning (UDL) & Accessibility course covers the full framework with practical classroom templates and a PD certificate upon completion.
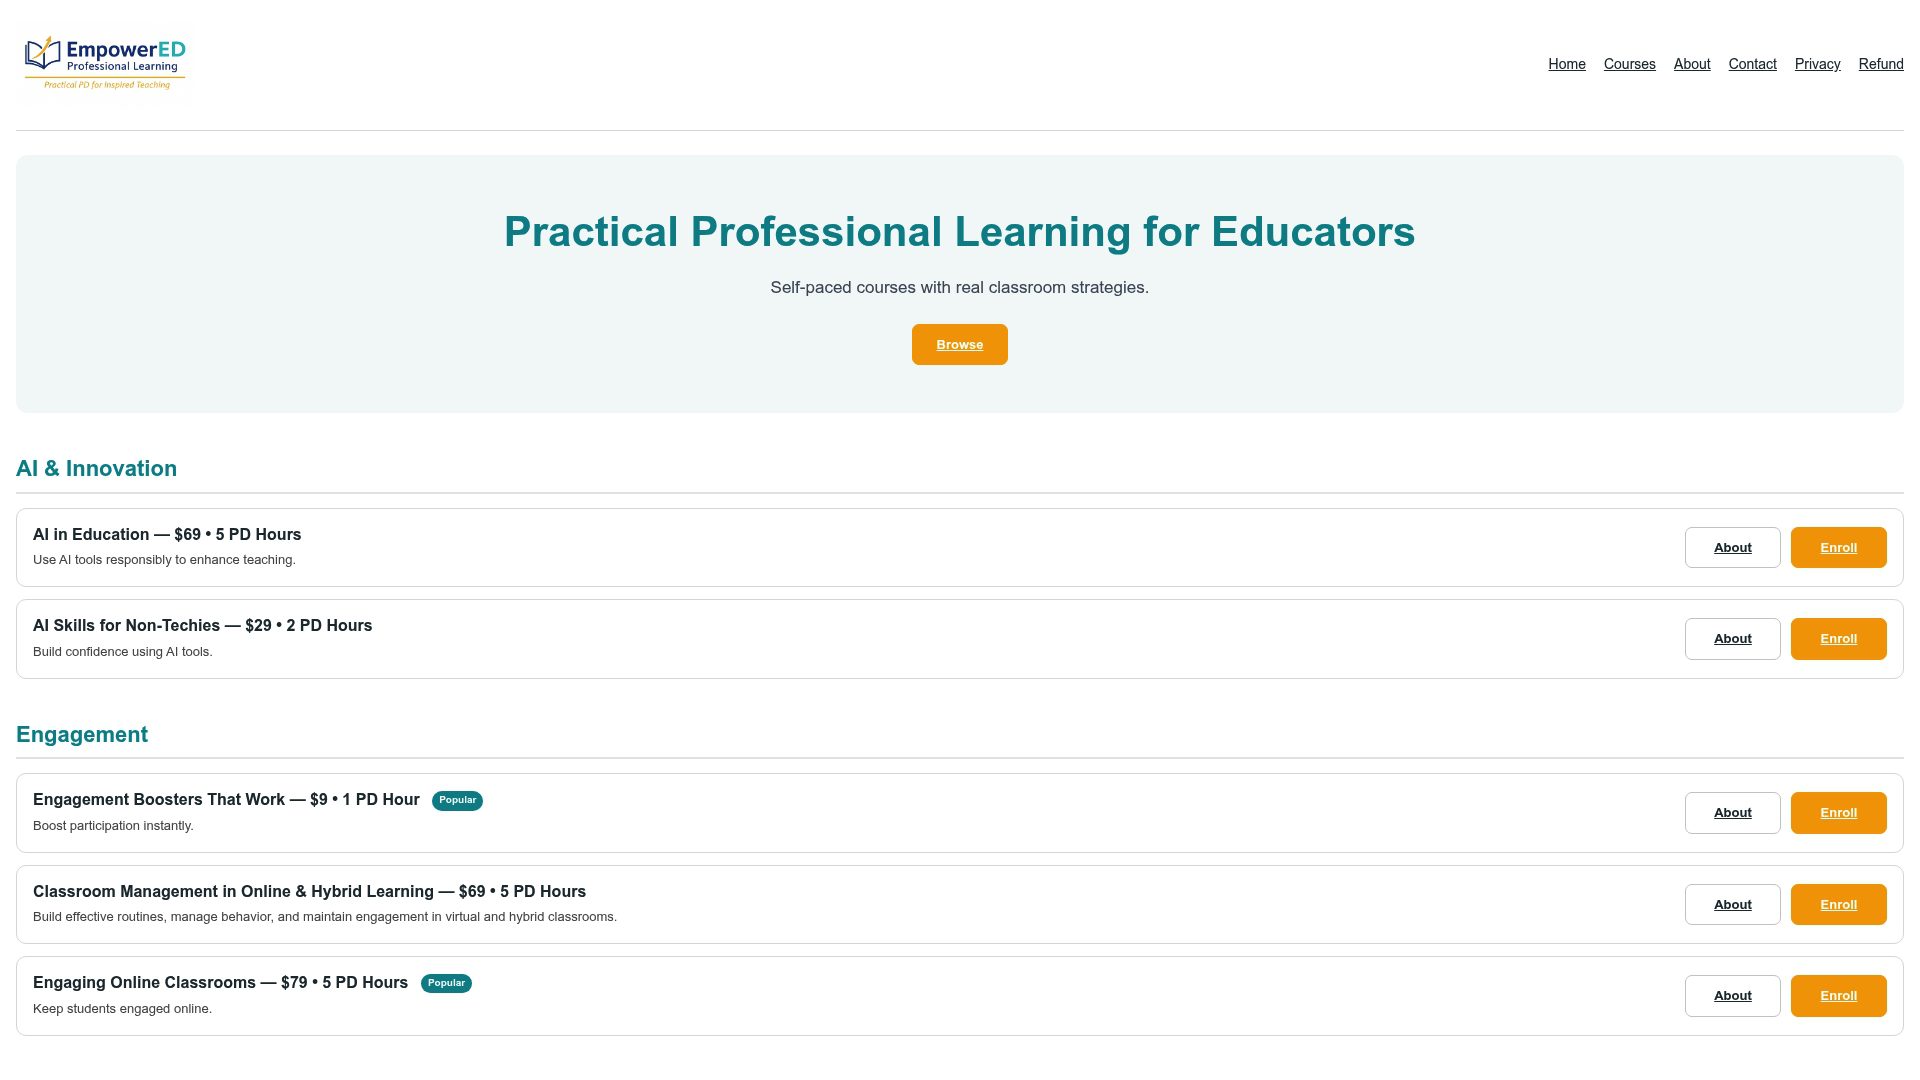
Both courses are self-paced and instructor-guided, so you can work through them on your own schedule and apply strategies the same week you learn them. PD certificates are included, making them straightforward to submit for continuing education credit. Enroll at Empowered Professional Learning and put these strategies into practice in your classroom right away.
Sources
- Frontiers in Psychology (2024) — meta-analytic research on learning styles
- CAST Universal Design for Learning Guidelines
- Universal Design for Learning (UDL) Guidelines | Texas Education Agency
- Boise State University faculty publication — review of visual displays (ViDis) in K–12 instruction
- Instructional Science (2024) — Testing the meshing hypothesis in prospective teachers
Recommended
- Engagement Tools for Visual Learners: Top 10 for K-12 – EmpowerED: Professional Development for Educators
- Active Learning Strategies for K–12 Teachers: Top 10 – EmpowerED: Professional Development for Educators
- Learning Styles Examples Every Educator Should Know – EmpowerED: Professional Development for Educators
- Classroom Questioning Strategies Examples for K-12 Teachers